Talk to our experts
Just type your contacts
SubSurfaceOps Editorial Team
Oil & Gas Value Chain Explained —
Where AI Creates Competitive Advantage
Read time: ~15 min
Keywords: oil and gas value chain, upstream midstream downstream oil and gas, AI in operations
Keywords: oil and gas value chain, upstream midstream downstream oil and gas, AI in operations
The financial case for AI is not in the technology budget
A 1% improvement in recovery rate across a mid-size operator's portfolio can mean $20–50M in annual uplift. Most of that value is already in the ground. The question — the one that keeps production engineers and operations VPs up at night — is which part of the chain is bleeding it away.
Upstream teams point to reservoir uncertainty. Midstream operators flag throughput constraints. Downstream planners blame crude supply variability. Everyone is right about their own slice of the problem. And that is precisely the problem.
The oil and gas value chain is not three separate businesses that happen to share a commodity. It is a single system of interdependent decisions — and the operators who treat it as one are already pulling ahead of those who don't. Industry data puts the global oil and gas AI market above $4 billion and growing (MarketsandMarkets, 2025), but the financial case for AI is not in the technology budget. It is in the production losses, maintenance spend, and margin compression that integrated decision-making can directly address.
This article is written for operations managers, digital transformation leads, and C-suite executives at mid-size US operators and oilfield service companies. It covers what each segment of the upstream midstream downstream oil and gas system actually controls, where AI is generating measurable returns today, and what integrated deployment looks like for companies that don't have a 50-person data science team on the payroll.
No textbook definitions. No vendor pitch. Just the operational perspective — because that's the only one that moves the needle.
Upstream teams point to reservoir uncertainty. Midstream operators flag throughput constraints. Downstream planners blame crude supply variability. Everyone is right about their own slice of the problem. And that is precisely the problem.
The oil and gas value chain is not three separate businesses that happen to share a commodity. It is a single system of interdependent decisions — and the operators who treat it as one are already pulling ahead of those who don't. Industry data puts the global oil and gas AI market above $4 billion and growing (MarketsandMarkets, 2025), but the financial case for AI is not in the technology budget. It is in the production losses, maintenance spend, and margin compression that integrated decision-making can directly address.
This article is written for operations managers, digital transformation leads, and C-suite executives at mid-size US operators and oilfield service companies. It covers what each segment of the upstream midstream downstream oil and gas system actually controls, where AI is generating measurable returns today, and what integrated deployment looks like for companies that don't have a 50-person data science team on the payroll.
No textbook definitions. No vendor pitch. Just the operational perspective — because that's the only one that moves the needle.
The Oil & Gas Value Chain — A Systems View, Not Just Segments
Why the Traditional Segment Breakdown Isn't Enough
Every operator knows the E&P / Midstream / Downstream taxonomy. It's how assets are organised, how P&Ls are structured, and how regulatory frameworks are drawn. It is also the single biggest contributor to cross-chain value destruction that most organisations never measure.
Think in flows, not silos. A well optimised for maximum production rate in West Texas is worth less if the gathering system running at 85% capacity creates backpressure that forces a choke. That throughput constraint is a midstream problem. The production loss shows up on an upstream KPI. The root cause sits in a planning gap that neither team owns. This is the oil and gas value chain problem that AI is uniquely positioned to solve — not because AI is novel, but because it can finally make the invisible handoffs between segments visible.
Estimates across the industry consistently show that 60–70% of operational data generated by oil and gas assets goes unused in real-time decision-making (various industry surveys, 2023–2025). That figure is not a technology failure. It is a systems failure — data that exists in one segment, in one historian, on one team's dashboard, and never crosses the organisational boundary where it would change a decision.
Think in flows, not silos. A well optimised for maximum production rate in West Texas is worth less if the gathering system running at 85% capacity creates backpressure that forces a choke. That throughput constraint is a midstream problem. The production loss shows up on an upstream KPI. The root cause sits in a planning gap that neither team owns. This is the oil and gas value chain problem that AI is uniquely positioned to solve — not because AI is novel, but because it can finally make the invisible handoffs between segments visible.
Estimates across the industry consistently show that 60–70% of operational data generated by oil and gas assets goes unused in real-time decision-making (various industry surveys, 2023–2025). That figure is not a technology failure. It is a systems failure — data that exists in one segment, in one historian, on one team's dashboard, and never crosses the organisational boundary where it would change a decision.
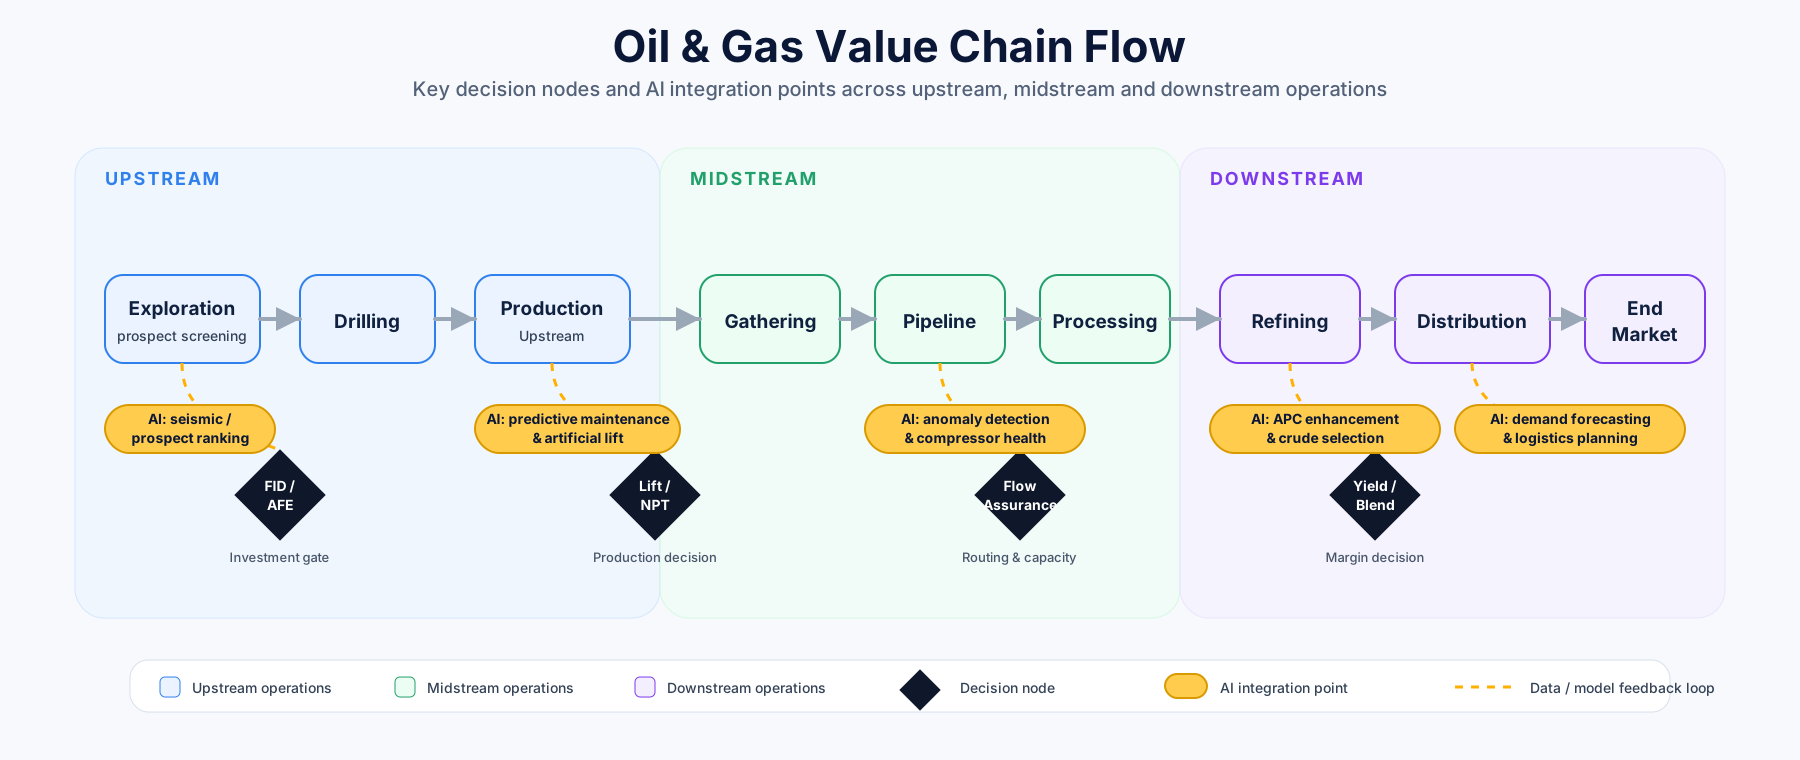
What Each Segment Actually Controls
Reframe each segment not by what it is, but by what decisions it owns:
- Upstream controls resource commitment: where to drill, how to complete, how to produce. Capital allocation decisions at this stage carry 20–30-year consequences. Mistakes compound.
- Midstream controls throughput economics: how much production reaches market, at what cost, and with what reliability. Midstream doesn't produce barrels — it determines how many upstream barrels translate into netback.
- Downstream controls margin realisation: crude selection, yield configuration, blending, and product distribution. Margins here are thin, cyclical, and directly sensitive to operational efficiency.
The Compounding Cost of Disconnected Operations
Here is a scenario that plays out across the Permian and Eagle Ford with regularity: an upstream team optimises artificial lift settings for maximum production. Simultaneously, a midstream operator schedules planned compression maintenance — reducing pipeline capacity by 15% for 72 hours. Downstream, a refinery planner adjusts crude orders based on yesterday's production report. Three teams, three datasets, zero coordination. The upstream operator either chokes back production or takes a penalty on netback. The midstream operator has no visibility into what that maintenance window costs the upstream team in deferred production. The refinery buys spot to cover the gap.
The aggregate financial impact of this kind of disconnection — across a mid-size operator running 20–30 producing fields — is not a rounding error. It is a structural drag on portfolio value that looks like operational variance on every individual P&L but never appears as a line item anyone owns.
Addressing this requires more than better technology in each segment. It requires the data architecture and decision workflows that allow all three segments to operate with shared situational awareness. That is where the real competitive advantage in the oil and gas value chain is being built.
The aggregate financial impact of this kind of disconnection — across a mid-size operator running 20–30 producing fields — is not a rounding error. It is a structural drag on portfolio value that looks like operational variance on every individual P&L but never appears as a line item anyone owns.
Addressing this requires more than better technology in each segment. It requires the data architecture and decision workflows that allow all three segments to operate with shared situational awareness. That is where the real competitive advantage in the oil and gas value chain is being built.
Upstream — Where Production Decisions Are Won or Lost
The Upstream Operating Environment
Upstream is where the largest capital commitments in oil and gas are made — and where the consequences of poor decision quality are most durable. A completion design that underperforms costs capital that cannot be recovered. A drilling programme that misses reservoir targets ties up rig time with no production upside. The upstream vs downstream oil and gas performance gap is often not about subsurface quality. It is about decision quality — the ability to act on the right data at the right moment in a capital-intensive, time-sensitive environment.
The operating environment has become structurally harder for mid-size operators. Commodity price volatility compresses the windows in which capital deployment makes sense. Well productivity decline rates in unconventionals mean that production is perpetually at risk without active optimisation. And the regulatory and ESG reporting burden continues to expand. Mid-size operators are running more complexity with teams that haven't grown proportionally.
The operators managing this well are not necessarily spending more on technology. They are making better use of the data they already have.
The operating environment has become structurally harder for mid-size operators. Commodity price volatility compresses the windows in which capital deployment makes sense. Well productivity decline rates in unconventionals mean that production is perpetually at risk without active optimisation. And the regulatory and ESG reporting burden continues to expand. Mid-size operators are running more complexity with teams that haven't grown proportionally.
The operators managing this well are not necessarily spending more on technology. They are making better use of the data they already have.
Where AI Is Generating Measurable Upstream Value
The commercial case for AI in upstream operations is now well-documented, with 5–15% production uplift on AI-optimised wells cited across SPE papers and operator case studies, and 10–20% reductions in non-productive time via predictive maintenance programmes (McKinsey Energy Practice; Deloitte Oil & Gas). These are not pilot programme figures — they are outcomes from operators who have moved from proof-of-concept to production deployment.
The use cases generating the most consistent returns break down across three areas:
For a deeper look at predictive maintenance in upstream assets, including failure mode libraries and sensor configuration benchmarks, see our dedicated analysis. On the production side, the mechanics of AI-driven production optimization — including model architecture and integration with existing SCADA infrastructure — is covered in the linked piece.
The use cases generating the most consistent returns break down across three areas:
- Production optimisation: Rate surveillance algorithms that monitor ESP performance, artificial lift efficiency, and wellhead conditions in real time — flagging decline anomalies hours before a human reviewing a daily production report would catch them. Reinforcement learning models that continuously adjust artificial lift setpoints to optimise production against operating constraints. For high-volume unconventional wells, the difference between an optimised and non-optimised lift configuration can be 50–150 bopd.
- Drilling and completions: Real-time geosteering support using physics-informed ML models that integrate LWD data, offset well performance, and geological models to reduce landing uncertainty. ROP optimisation that adjusts WOB and rotary speed in response to lithological changes — reducing bit wear and improving footage per day. On a 30-well development programme, a 5% improvement in drilling efficiency is material capex.
- Predictive maintenance: Time-series anomaly detection on surface and subsurface equipment — compressors, pump jacks, ESPs — that identifies degradation signatures before failure. For operators running 200+ artificial lift installations, the difference between scheduled intervention and emergency workover is a $30–80K cost swing per event, plus deferred production.
For a deeper look at predictive maintenance in upstream assets, including failure mode libraries and sensor configuration benchmarks, see our dedicated analysis. On the production side, the mechanics of AI-driven production optimization — including model architecture and integration with existing SCADA infrastructure — is covered in the linked piece.
What Mid-Size Operators Need to Get Right
Supermajors can staff a 40-person data science function and build proprietary ML infrastructure. A mid-size Permian operator running 500 BOE/day per well equivalent does not have that option — and shouldn't need it.
The data readiness conversation is more important than the AI vendor conversation. Historian data quality — tagging consistency, scan rates, gap handling — determines whether a predictive model can be trained. Operators who have invested in basic PI tagging standards and data governance find that the time to value on ML deployments drops from 9–12 months to 3–6 months. The technology is available. The data foundation is the bottleneck.
The practical approach: scope targeted use cases with clear ROI profiles, deploy on a subset of the asset base, and expand once the operational workflow — not just the model — is proven. Enterprise-wide AI transformation is a multi-year programme. The first commercial return should come in under 12 months.
The data readiness conversation is more important than the AI vendor conversation. Historian data quality — tagging consistency, scan rates, gap handling — determines whether a predictive model can be trained. Operators who have invested in basic PI tagging standards and data governance find that the time to value on ML deployments drops from 9–12 months to 3–6 months. The technology is available. The data foundation is the bottleneck.
The practical approach: scope targeted use cases with clear ROI profiles, deploy on a subset of the asset base, and expand once the operational workflow — not just the model — is proven. Enterprise-wide AI transformation is a multi-year programme. The first commercial return should come in under 12 months.

Midstream — The Data Blind Spot of the Value Chain
What Midstream Actually Controls (and Why It's Misunderstood)
Midstream throughput constraints are a hidden tax on upstream netback — one that doesn't appear in any single P&L, and rarely appears in the right conversation. Midstream is treated operationally as a pass-through: barrels go in, barrels come out. This is a strategic error with direct financial consequences.
Midstream infrastructure — gathering systems, transmission pipelines, compression stations, NGL fractionation trains, and storage facilities — doesn't just move product. It sets the ceiling on what upstream production is worth. A producer whose gathering agreement includes a take-or-pay provision is financially exposed every time compression capacity drops below contracted throughput. A gas processor whose fractionation train is running at reduced capacity due to an unplanned maintenance event is losing NGL revenue by the hour.
For a full treatment of midstream operations and data challenges, including the economic linkages between midstream configuration and upstream netback, see our dedicated piece. Understanding this relationship is a prerequisite for any cross-segment AI strategy.
Midstream infrastructure — gathering systems, transmission pipelines, compression stations, NGL fractionation trains, and storage facilities — doesn't just move product. It sets the ceiling on what upstream production is worth. A producer whose gathering agreement includes a take-or-pay provision is financially exposed every time compression capacity drops below contracted throughput. A gas processor whose fractionation train is running at reduced capacity due to an unplanned maintenance event is losing NGL revenue by the hour.
For a full treatment of midstream operations and data challenges, including the economic linkages between midstream configuration and upstream netback, see our dedicated piece. Understanding this relationship is a prerequisite for any cross-segment AI strategy.
The Data Problem No One Is Talking About
The midstream sector runs on SCADA — and SCADA data is genuinely rich. Pressure, flow, temperature, compressor performance, valve positions: the sensor infrastructure on a modern pipeline system generates gigabytes of operational data per day. The problem is not data volume. The problem is data architecture.
Midstream sensor data is typically siloed by facility, sampled at intervals that are too coarse for real-time anomaly detection, and stored in systems that were designed for regulatory reporting, not operational intelligence. Most operators are running scheduled maintenance programmes that have not materially changed in fifteen years — driven by manufacturer intervals and regulatory requirements, not actual equipment condition.
The financial exposure here is not trivial. Unplanned pipeline and compression incidents cost the industry $1–5M per event in direct repair and remediation costs alone, before accounting for deferred throughput, supply disruptions to downstream customers, or regulatory penalties (PHMSA incident data). The majority of these events are preceded by detectable degradation signatures — signatures that exist in SCADA data that no one has configured a model to watch.
Midstream sensor data is typically siloed by facility, sampled at intervals that are too coarse for real-time anomaly detection, and stored in systems that were designed for regulatory reporting, not operational intelligence. Most operators are running scheduled maintenance programmes that have not materially changed in fifteen years — driven by manufacturer intervals and regulatory requirements, not actual equipment condition.
The financial exposure here is not trivial. Unplanned pipeline and compression incidents cost the industry $1–5M per event in direct repair and remediation costs alone, before accounting for deferred throughput, supply disruptions to downstream customers, or regulatory penalties (PHMSA incident data). The majority of these events are preceded by detectable degradation signatures — signatures that exist in SCADA data that no one has configured a model to watch.
AI Use Cases in Midstream Operations
The highest-impact AI applications in midstream are not about replacing SCADA. They are about putting analytical capability on top of the data SCADA already collects:
- Anomaly detection: Pressure deviation flagging and flow imbalance alerts that distinguish genuine operational anomalies from sensor noise — reducing the false alarm rate that causes operators to ignore threshold alerts. Production-deployed anomaly detection on transmission pipelines has demonstrated 15–30% reductions in unplanned downtime in documented operator programmes.
- Leak detection and localisation: Flow-modelling approaches that integrate upstream production metering with downstream delivery measurement to identify mass balance discrepancies in near-real-time. Combined with SCADA integration, these systems can localise anomalies to pipeline segments within minutes — compared to hours or days with manual reconciliation.
- Compressor health monitoring: Vibration, temperature, and suction/discharge pressure signatures that enable condition-based maintenance scheduling — replacing calendar-based overhaul intervals with data-driven interventions timed to actual equipment condition. For a compression-heavy gathering system, this directly reduces planned maintenance downtime and extends run life between major overhauls.
- Throughput optimisation: Scheduling models that match upstream production nominations to midstream capacity in real time — reducing curtailments and improving utilisation of existing infrastructure without capital investment.

Downstream — Margin Optimisation at Scale
The Downstream Margin Equation
Refining margins are cyclical, structurally thin, and largely outside the control of the operator. Crack spreads move with macro supply-demand dynamics, product differentials reflect regional logistics and regulatory compliance costs, and crude acquisition costs respond to geopolitical factors that no refinery planning team can model reliably. What a refinery can control — and where AI changes the economics — is the operational efficiency that determines where actual margins land relative to the theoretical benchmark.
The cost levers that matter in refining are energy intensity, yield optimisation, maintenance turnaround timing, and blending economics. Each of these is a complex, multi-variable optimisation problem that conventional process control handles adequately but not optimally. The gap between adequate and optimal is where margin lives.
A 100,000 bpd refinery operating at a 2% suboptimal yield configuration is leaving 2,000 barrels per day in realised margin on the table — at a $5/bbl differential, that is $3.6M annually. This is not a capital investment problem. It is a decision quality problem that AI-augmented operations can address without new hardware.
The cost levers that matter in refining are energy intensity, yield optimisation, maintenance turnaround timing, and blending economics. Each of these is a complex, multi-variable optimisation problem that conventional process control handles adequately but not optimally. The gap between adequate and optimal is where margin lives.
A 100,000 bpd refinery operating at a 2% suboptimal yield configuration is leaving 2,000 barrels per day in realised margin on the table — at a $5/bbl differential, that is $3.6M annually. This is not a capital investment problem. It is a decision quality problem that AI-augmented operations can address without new hardware.
Where AI Changes the Refinery Economics
The commercial benchmarks for AI in downstream operations have become well-established, with 0.5–2% yield improvement and 5–10% reduction in energy intensity reported across Honeywell and AspenTech deployment case studies. For a large refinery, the lower bound of that range is a material P&L line item.
The applications generating the most consistent returns:
The applications generating the most consistent returns:
- Advanced Process Control enhancement: ML layers on top of existing APC and PID control systems that adapt setpoints in response to feed quality variability — moving beyond the static tuning parameters that conventional APC uses. Particularly valuable for units processing variable crude slates where conventional controllers are retuned quarterly at best.
- Crude selection and blending optimisation: Real-time recommendation engines that evaluate available crude parcels against current unit configurations, product demand forecasts, and regulatory blend constraints — recommending the crude slate that maximises margin contribution. This bridges the operations-commercial gap that is often managed manually by experienced planners who are one retirement away from knowledge loss.
- Demand forecasting and yield planning: 30–90 day forward visibility into product demand patterns that allows refinery planners to configure crude acquisition and unit utilisation around actual market signals rather than rolling historical averages. Particularly valuable for operators managing multiple product specs across regional markets with different demand dynamics.
- Energy optimisation: Heat exchanger fouling prediction that schedules cleaning interventions before efficiency degradation reaches the point of measurable energy cost increase. Utility load scheduling that coordinates steam, hydrogen, and power consumption across units to reduce peak demand charges and improve energy cost per barrel.
The Integrated Downstream Opportunity
The downstream operators extracting the most value from AI are not deploying it exclusively in refinery operations. They are connecting refinery performance data to their trading and crude procurement functions — creating a decision loop that runs from crude acquisition through product distribution in near-real time.
The scenario looks like this: an ML-assisted crude selection model ingests current market prices for available crude parcels, live unit performance data from the refinery, forward product demand signals from marketing, and regulatory blend constraint data. It surfaces a recommendation — with margin impact quantified — that the crude scheduler can act on within the commercial window before price discovery closes. This kind of capability was historically available only to supermajors with proprietary trading infrastructure. It is increasingly accessible to mid-size downstream operators through cloud-native platforms that integrate with existing refinery information systems.
The scenario looks like this: an ML-assisted crude selection model ingests current market prices for available crude parcels, live unit performance data from the refinery, forward product demand signals from marketing, and regulatory blend constraint data. It surfaces a recommendation — with margin impact quantified — that the crude scheduler can act on within the commercial window before price discovery closes. This kind of capability was historically available only to supermajors with proprietary trading infrastructure. It is increasingly accessible to mid-size downstream operators through cloud-native platforms that integrate with existing refinery information systems.

AI Across the Full Value Chain — Where Integration Delivers the Biggest Returns
Why Single-Segment AI Deployments Are Suboptimal
Upstream AI that doesn't share data with midstream scheduling creates a familiar problem: production is optimised to a rate that midstream cannot reliably absorb. Downstream planning that doesn't integrate upstream production forecasts places crude orders on stale data — missing optimisation windows that open and close in hours, not days. Single-segment deployments improve local performance but leave the cross-chain value creation untouched.
The operators who are demonstrably ahead on AI ROI are deploying it as a coordination layer, not just a performance layer. The goal is not to have the best AI model in upstream. It is to have a data architecture that allows upstream production signals to inform midstream scheduling decisions, midstream throughput data to feed downstream crude planning, and downstream margin data to flow back into upstream prioritisation. That is a fundamentally different design brief — and it requires a fundamentally different approach to digital twin deployment across the value chain.
The operators who are demonstrably ahead on AI ROI are deploying it as a coordination layer, not just a performance layer. The goal is not to have the best AI model in upstream. It is to have a data architecture that allows upstream production signals to inform midstream scheduling decisions, midstream throughput data to feed downstream crude planning, and downstream margin data to flow back into upstream prioritisation. That is a fundamentally different design brief — and it requires a fundamentally different approach to digital twin deployment across the value chain.
The Architecture of an AI-Ready Value Chain
This is not a technology specification. It is an operational capability model — what needs to be true about how your organisation collects, manages, and acts on data before AI can deliver cross-chain value.
Four capabilities define an AI-ready value chain:
Four capabilities define an AI-ready value chain:
- Data infrastructure quality: Historian data that is consistently tagged, sampled at operationally meaningful frequencies, and accessible across organisational boundaries. Without this, models trained on upstream data cannot interact with midstream or downstream systems.
- ML model operationalisation: Models that are deployed into operational workflows — not sitting in a data scientist's notebook. Operationalised means the model output is visible to the operator who needs to act on it, in the system they already use.
- Decision workflow integration: Processes that have been redesigned around AI-augmented decision-making. A predictive maintenance alert that reaches a maintenance planner 48 hours before a failure is only valuable if the planner has an intervention procedure that can act on it in time.
- Continuous feedback loops: Model performance monitoring and retraining infrastructure that keeps models calibrated as operating conditions change. A model trained on 2022 operating data that has not been updated is a liability, not an asset, in 2026.

What the ROI Actually Looks Like
Documented integrated AI programmes in oil and gas — covering upstream through downstream deployment — are showing 8–15% OPEX reduction across the value chain (McKinsey Global Institute; IEA Energy Efficiency report series). This is not a number from a vendor case study. It is an aggregate benchmark from programmes where operators have committed to cross-segment data integration and decision workflow redesign, not just individual use case deployments.
The time-to-value profile is bifurcated. Targeted use cases — artificial lift optimisation, compressor anomaly detection, energy monitoring — deliver first commercial returns in 3–6 months for operators with adequate data foundations. Platform-level programmes that redesign cross-segment data flows and decision integration take 12–24 months to fully mature, but the opex reduction at that point is compounding, not one-time.
The cost of inaction is also compounding. Operators who are not building data infrastructure today are accumulating what the industry is starting to call data debt — the gap between the operational intelligence their asset base could deliver and what their current architecture actually captures. Competitors who have been investing in data readiness for 3–4 years will have training data sets that new entrants cannot replicate quickly.
The time-to-value profile is bifurcated. Targeted use cases — artificial lift optimisation, compressor anomaly detection, energy monitoring — deliver first commercial returns in 3–6 months for operators with adequate data foundations. Platform-level programmes that redesign cross-segment data flows and decision integration take 12–24 months to fully mature, but the opex reduction at that point is compounding, not one-time.
The cost of inaction is also compounding. Operators who are not building data infrastructure today are accumulating what the industry is starting to call data debt — the gap between the operational intelligence their asset base could deliver and what their current architecture actually captures. Competitors who have been investing in data readiness for 3–4 years will have training data sets that new entrants cannot replicate quickly.

What Mid-Size Operators Should Do First
Start With the Highest-Value Data You Already Have
The most common mistake mid-size operators make when approaching AI deployment is starting with the vendor conversation. Before any RFP or proof-of-concept discussion, the operational question is: what data do we already have, and is it in usable condition?
Most operators have years of untapped signal in their SCADA historians (OSIsoft PI, AspenTech IP.21), well test databases, and production allocation systems. The average mid-size operator has more training data available than they need for the first 3–5 AI use cases — but it exists in forms that require clean-up before it can be used. Inconsistent tag naming conventions, gaps from sensor failures, and historian compression settings that were configured for storage efficiency rather than ML feature extraction are the practical obstacles. None of them are insurmountable. All of them should be understood before a vendor is engaged.
Most operators have years of untapped signal in their SCADA historians (OSIsoft PI, AspenTech IP.21), well test databases, and production allocation systems. The average mid-size operator has more training data available than they need for the first 3–5 AI use cases — but it exists in forms that require clean-up before it can be used. Inconsistent tag naming conventions, gaps from sensor failures, and historian compression settings that were configured for storage efficiency rather than ML feature extraction are the practical obstacles. None of them are insurmountable. All of them should be understood before a vendor is engaged.
Your best AI project is probably already sitting in a SCADA historian. The question is whether your data foundation is clean enough to find it.
A focused data audit — two to four weeks with the right engineering resource — is the highest-return pre-investment an operator can make before committing to an AI programme. It will scope the actual work required, surface the highest-quality data assets, and identify the use cases where deployment risk is lowest and ROI is clearest.
Target Use Cases With Fast ROI Cycles
For operators starting from a standing start, three use cases consistently deliver commercial returns within the first deployment year:
- Artificial lift optimisation (upstream) — 60–90 day deployment timeline for operators with clean SCADA historian data. Models trained on existing production and ESP/pump jack operating data. Immediate production uplift — typically 3–8% on optimised wells. No new sensors or infrastructure required.
- Compressor anomaly detection (midstream) — Condition monitoring on existing SCADA data streams. Prevents unplanned compression downtime that directly impacts upstream netback. ROI window of 3–6 months when a single avoided unplanned event is factored in. High operator acceptance because the alert workflow maps directly onto existing maintenance procedures.
- Energy monitoring and fouling prediction (downstream) — Heat exchanger fouling detection using process temperature and pressure differential trends. Reduces utility spend by scheduling cleaning interventions at the point of maximum efficiency impact. 6–9 month payback period on a medium-complexity refinery, improving toward 3–4 months as the model matures.
The Value Chain Is the Strategy
The oil and gas value chain is not three business lines with a shared commodity. It is a single system — and every operational decision made without visibility across all three segments is leaving value on the table that a competitor with better data integration will eventually capture.
The operators pulling ahead in 2025–2026 are not necessarily the ones with the largest AI budgets. They are the ones who have treated data infrastructure as an operational investment, not an IT project. They have scoped use cases that deliver commercial returns in under 12 months. They have built the feedback loops that keep models calibrated as operating conditions change. And they have started the organisational work of redesigning decision workflows — not just deploying models — around AI-augmented operations.
The digital transformation of the oil and gas value chain is not an event. It is a capability that compounds. Operators who start building it now will have a structural advantage in three years that cannot be bought quickly. Operators who wait will be managing a data deficit that grows every quarter they delay.
The window for mid-size operators to move first — before this becomes table stakes — is still open. It won't be indefinitely.
The operators pulling ahead in 2025–2026 are not necessarily the ones with the largest AI budgets. They are the ones who have treated data infrastructure as an operational investment, not an IT project. They have scoped use cases that deliver commercial returns in under 12 months. They have built the feedback loops that keep models calibrated as operating conditions change. And they have started the organisational work of redesigning decision workflows — not just deploying models — around AI-augmented operations.
The digital transformation of the oil and gas value chain is not an event. It is a capability that compounds. Operators who start building it now will have a structural advantage in three years that cannot be bought quickly. Operators who wait will be managing a data deficit that grows every quarter they delay.
The window for mid-size operators to move first — before this becomes table stakes — is still open. It won't be indefinitely.
CONTINUE READING — SUBSURFACEOPS CONTENT CLUSTER
intro
About SubSurfaceOps
SubSurfaceOps delivers operations intelligence for the oil and gas industry — built for operators who run complex assets without supermajor resources. Our platform and advisory practice covers upstream production optimisation, midstream asset monitoring, and downstream process efficiency. Explore how SubSurfaceOps supports AI deployment across the full upstream midstream downstream oil and gas value chain at subsurfaceops.com.